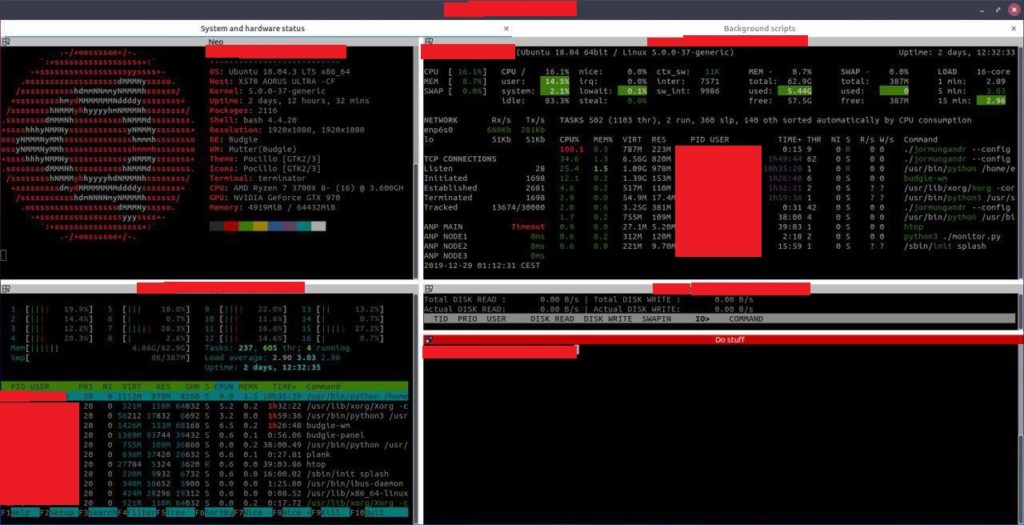
I tought I would share my current screen setup on the server. I am using terminator bash terminals and hardware monitoring is your standard stuff like Glances, Htop and Iotop. But also I use Chrony for making sure my system clock is up to date and tuned to make sure my network is up to date, both running as services on the computer. I had my own custom made scripts for forking / bootstrap checking but replaced them with the great script Redoracle made. I also run Prometheus, Grafana and Nginx for monitoring and websites and a few security measurements, one of them that I think its fine to mention is I run Fail2ban. I have removed some information that could affect security and replaced with a red bar.
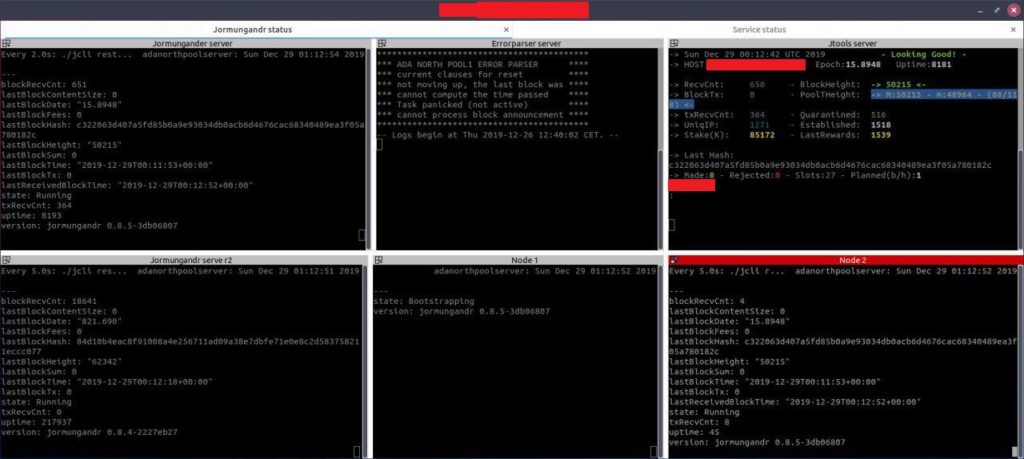
Some of the hardware monitoring. I have a default view and a view also with background scripts (for example I check how well Chrony is doing in making sure my system clock is as accurate as possible) Currently the hardware is running a main server, 2 nodes and one extra server that I am helping IOHK out testing with. I run an error parser script and I also run the great script from Redoracle mentioned above and with Github link to its repository if anyone else wants to use the same. As you can see from the above pictures we have plenty of hardware resource room to grow utilizing somewhere around 10-15% CPU and around 10% of memory. Connections vary between 2000-4000 and tracked connections are around 13000-15000. In the “do stuff” box I run scripts from time to time like checking how many files open on the system (usually 18000-20000 at any given moment) or watt usage of my Nvidia card (sadly around 18 watt so more than what I expected but luckily since CPU is only at 10% utilization the Ryzen draws less power than what I expected as well.)